


© Hamfield 2014
Works with all C-Bus Measurement
types & HVAC temp broadcast.
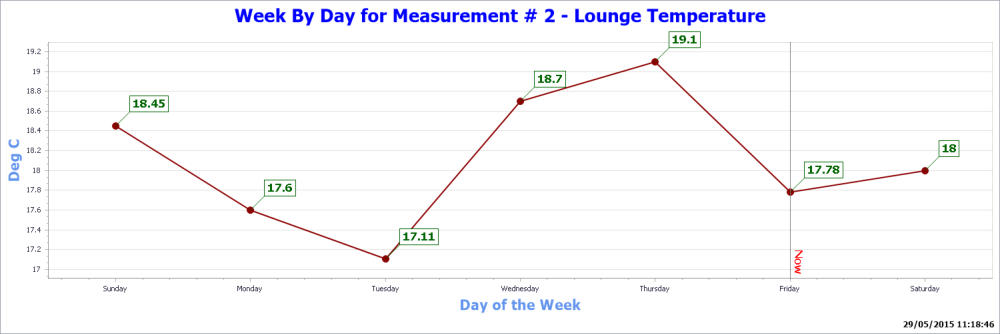
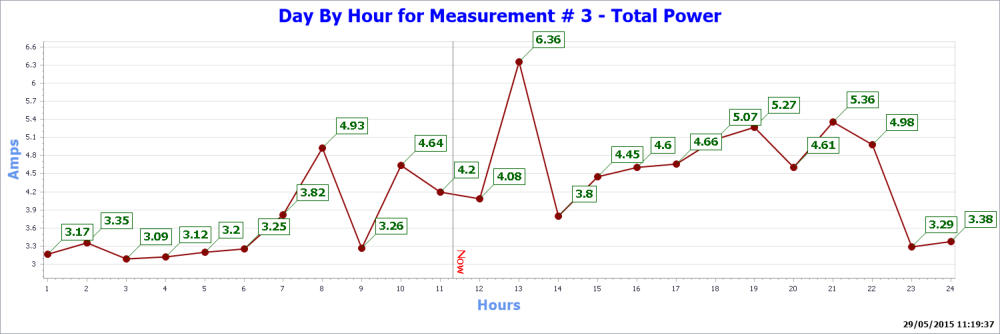
Utilising Translinks ability to process C-Bus measurement
application messages, long term charting can be achieved.
Charts are automatically created for any device that uses the C-
Bus measurement application or the HVAC Temperature
measurement as setup in Translink.
These charts are created with the following resolutions for each
specified measurement;
•
Hour by 5 minute intervals
•
Day by Hour intervals
•
Week by Day interval
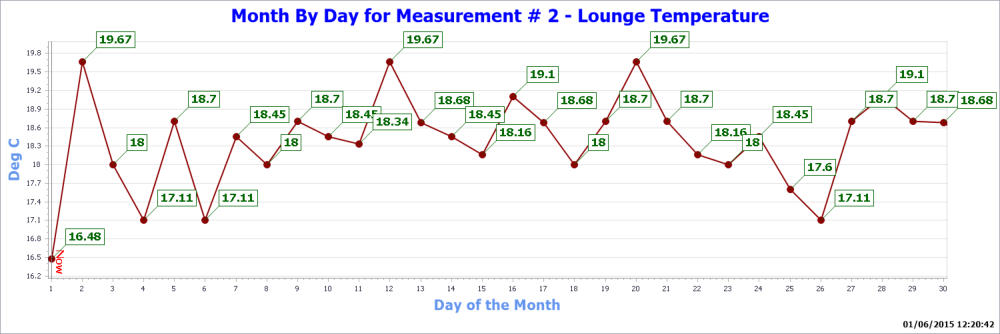
•
Month by Day interval
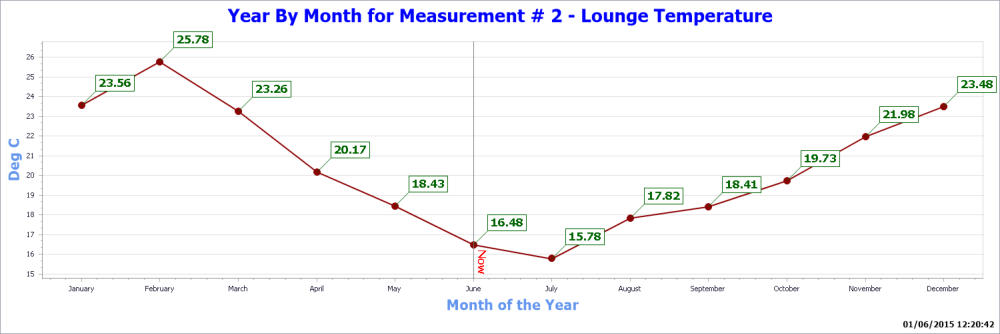
•
Year by Month interval
The output from these charts are saved a PNG files, making
them ideal for inclusion in a web site.
Software & Website Source Code
Included
An example website is included, which can be freely modified
and customised to suit a particular installation.
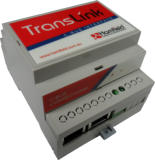
How it Works
Measurement information is output from the translink controller
every time it is received from the C-Bus network.
This information is transferred via the Debug port on the
Translink Programming & Debug adaptor connected to any PC
running the Translink Logger application.
The translink Logger application averages and keeps track of all
the incoming information and automatically produces the charts,
saving them whereever specified during the setup.
Requirements
(in addition to a standard Translink installation)
•
Controller Firmware 3.0.2 or greater (free download)
•
Translink Programming & Debug adaptor
•
PC running Translink Logger Application
•
Serial RS232 connection between the Programming &
debug adaptor and the PC.


C-Bus Gateway V3
Total Average Power


Measurement Monitoring and Charting
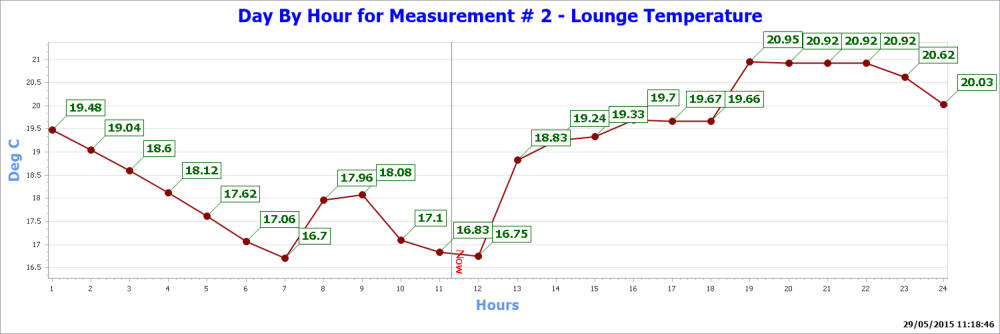
Average Lounge Temperature